Recall that the empirical work for the five phases of lateral pressure research summarized above tends to view expansion in terms of actual behavior (rather than the propensity for expansion).The difference is nuanced, but important: Behavior metrics are recorded after the fact. They usually reflect capability as well as intent. While this is consistent with the theory, it bypasses the thorny problem of metricizing the propensity factor first, and only then of examining connections to actual behavior. It also prevents us from exploring the potential gap or difference between propensity and behavior—and the implications thereof.
More recently, we developed the Lateral Pressure Index to quantify the propensity for expansion and, to the extent possible, to highlight the relative salience of the individual drivers. After some experimental efforts, we framed the LP Index, for a country i at time j,as a function of the geometric mean of the master variables:

where
Pi,j, and Ti,j, Ri,j are the measures of population, resource and technology respectively for country i in year j.
We can now turn to a couple of additional questions explored in the sixth phase of lateral pressure investigations: Does the propensity to expand in the real domain similar or different to that in the cyber arena? Are the driving master variables similar or different?
Lateral Pressure in Real Domain
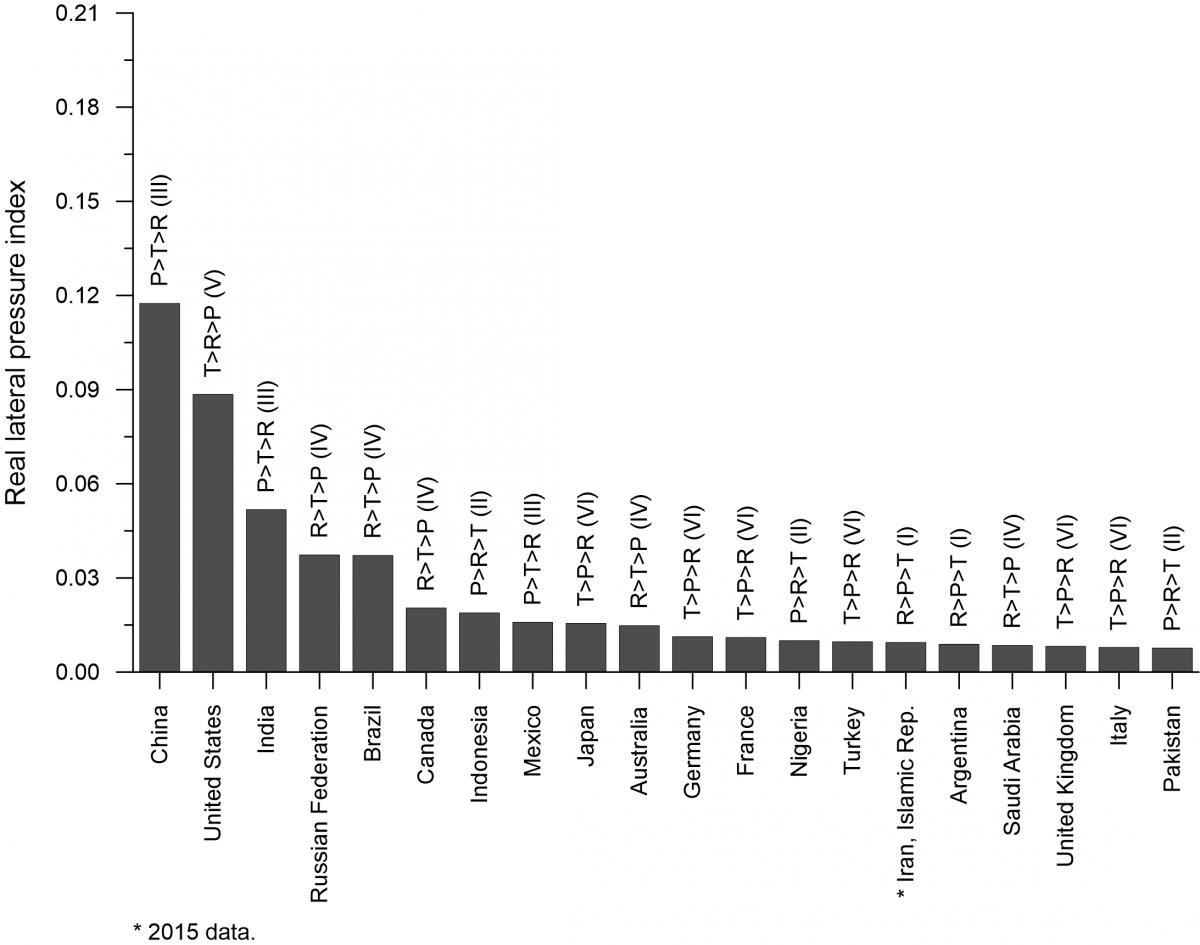
We begin with the distribution of countries ranked by their real LP Index and identify their profile type as shown in figure below. Several results stand out:
 |
|---|
| States ordered by real lateral pressure index and identified by real profile, 2016. Source: Choucri and Clark (2019). |
China ranks highest in the propensity of expansion in the real domain, followed by the United States, and then India. For China and India, as well as for Indonesia, Mexico, Nigeria, and others, the propensity for expansion is driven more by population than by resources or technology. It is perhaps to be expected that technology is dominant in shaping lateral pressure for the United States, as well as Japan, Germany, France, and others. And resources are the critical drivers of lateral pressure for Brazil, Russia, Canada, Australia, and Iran.
Lateral Pressure in Cyber Domain
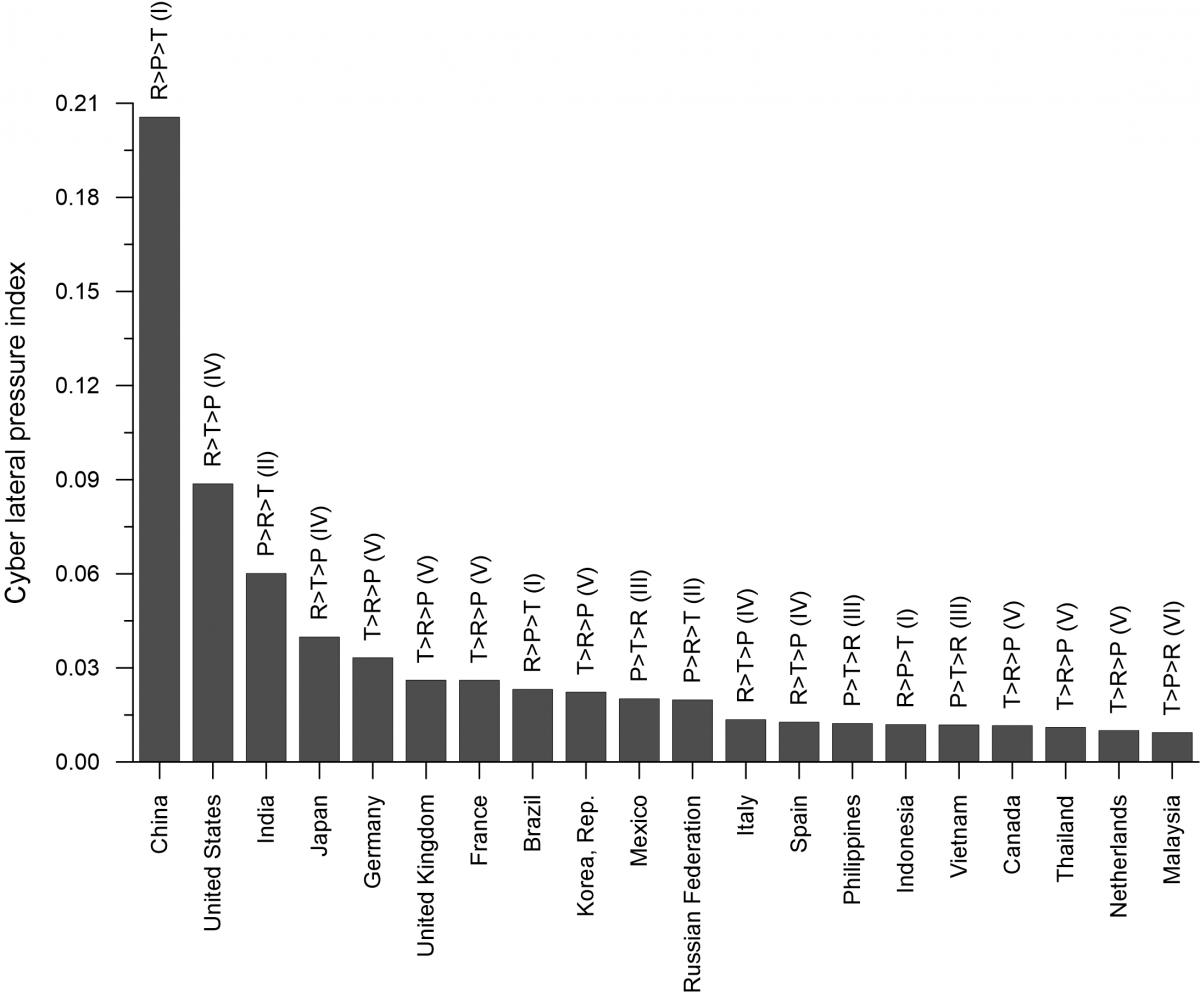
Figure below displays the top countries with the highest propensity for expansion in cyberspace and identifies their cyber profile type.
 |
|---|
| States ordered by cyber lateral pressure index and identified by cyberprofile, 2015. Source: Choucri and Clark (2019). |
High Level Comparison of Lateral Pressure in the Cyber versus the Real Domain
Figure below presents the logarithmic distribution of the LP Index for the traditional order and for cyberspace, and the inset shows the same in the original metrics. Clearly, the top rankings in lateral pressure, real and cyber, go to China, the United States, and India—in that order. The equalityline in Figure below signals similar propensity for expansion in the cyber and the real domains. States situated above the line are those with greater lateral pressure in cyberspace than in the traditional international arena. States below the equality line demonstrate more lateral pressure in the traditional mode than they do in cyberspace. A closer look enables added, more detailed, inferences pertaining to states and profile type.
 |
|---|
| Comparison of lateral pressure index in real domain, 2016 and cyber domain, 2015. Source: Choucri and Agarwal (2017). |
States with technology dominance in real Profile V (T>R>P) and Profile VI (T>P>R)—such as the United States, Japan, Germany, United Kingdom, and France—are leaders in the cyber domain. By contrast, states with real resource dominance—such as South Africa and Colombia in Profile I (R>P>T) and Russia, Brazil, Canada, Saudi Arabia and Australia in Profile IV (R>T>P) show less propensity for cyber than for real expansion. The same holds for countries for real Profile II: (P>R>T) states whose population dominates, but resources are greater than technology, (as such as Indonesia, Nigeria, Pakistan, and Egypt. Profile III (P>T>R) countries, also with population dominance, but with technology greater than re sources in real—such as China, India, Mexico, Thailand, and Philippines—exhibit greater lateral pressure in cyberspace than in the traditional world.
On balance, several patterns are noteworthy: First, many states demonstrate different profiles type in the real vs. cyber domain. Second, states also differ in the dominant master variable that is evident in their lateral pressure—real or cyber. Third, with notable exceptions, individual states also differ in the propensity to expand in the real vs. the cyber world. Fourth, it is perhaps to be expected that real technology is the salient factor for lateral pressure in cyberspace. Finally, while these observations are state-based, it is useful to signal some added inferences for the international system as a whole. For example, the cluster situated bottom left of the inset in Figure above situate states with limited, if any, lateral pressure—real or cyber. Concurrently, the correlation coefficient, also in the inset, points to more systemwide (or overall) convergence than divergence lateral pressure, real vs. cyber.
Reference:
- Choucri, N., & Agarwal, G. (2017). The theory of lateral pressure: Highlights of quantification and empirical analysis
. In W. R. Thompson (Ed.), The Oxford Encyclopedia of Empirical International Relations Theory. Oxford University Press.
- Choucri, N., & Clark, D. D. (2019). International relations in the cyber age: The co-evolution dilemma
. MIT Press.